Timely Access to Surgical Care in Indonesia
Workforce, volume, and spatial coverage — ARC8 Global Surgery Institute
ARC Institute · 8.3 Timely Access
2026-04-23
Study objectives
- Describe the national distribution of surgical workforce capability (SAO teams) across Indonesian hospitals
- Quantify bellwether procedure volumes from BPJS claims (2016–2024)
- Link workforce capability to surgical output at district level
- Map population spatial access to SAO-capable hospitals (ArcGIS network analysis)
- Test whether poor spatial access drives patient cross-district outflow
Data sources
| SIRS |
National hospital registry — class, beds, location |
2025 snapshot |
| DREAMS |
Specialist workforce — headcount (HC) + practice permits (SIP) |
2025 snapshot |
| BPJS Kesehatan |
Inpatient claims — ICD-9-CM procedures, member weights |
2016–2024 |
| ArcGIS Network Analyst |
Hospital service-area polygons (2 hr drive-time) |
2025 |
| WorldPop |
Gridded population raster — district catchment population |
2020 |
SAO capability framework
SAO = Surgeon (gen surgery + orthopaedics) · Anesthesiologist · Obstetrician/Gynaecologist
Five criteria assessed in parallel — from most permissive to most demanding:
| SAO ≥1 (HC) |
S, A, O each ≥1 by primary-workplace headcount |
1175 |
36% |
| SAO ≥1 (SIP) |
S, A, O each ≥1 by practice permit (all sites) |
2680 |
82% |
| SO ≥1 (HC) |
S ≥1, O ≥1 by headcount — anaesthesia gap allowed |
1489 |
45% |
| SAO ≥2 (SIP) |
S, A, O each ≥2 by practice permit — full minimum team |
1593 |
49% |
| SO ≥2 (SIP) |
S ≥2, O ≥2 by practice permit — anaesthesia gap allowed |
1881 |
57% |
Bellwether procedures: C-section · Open fracture fixation · Laparotomy
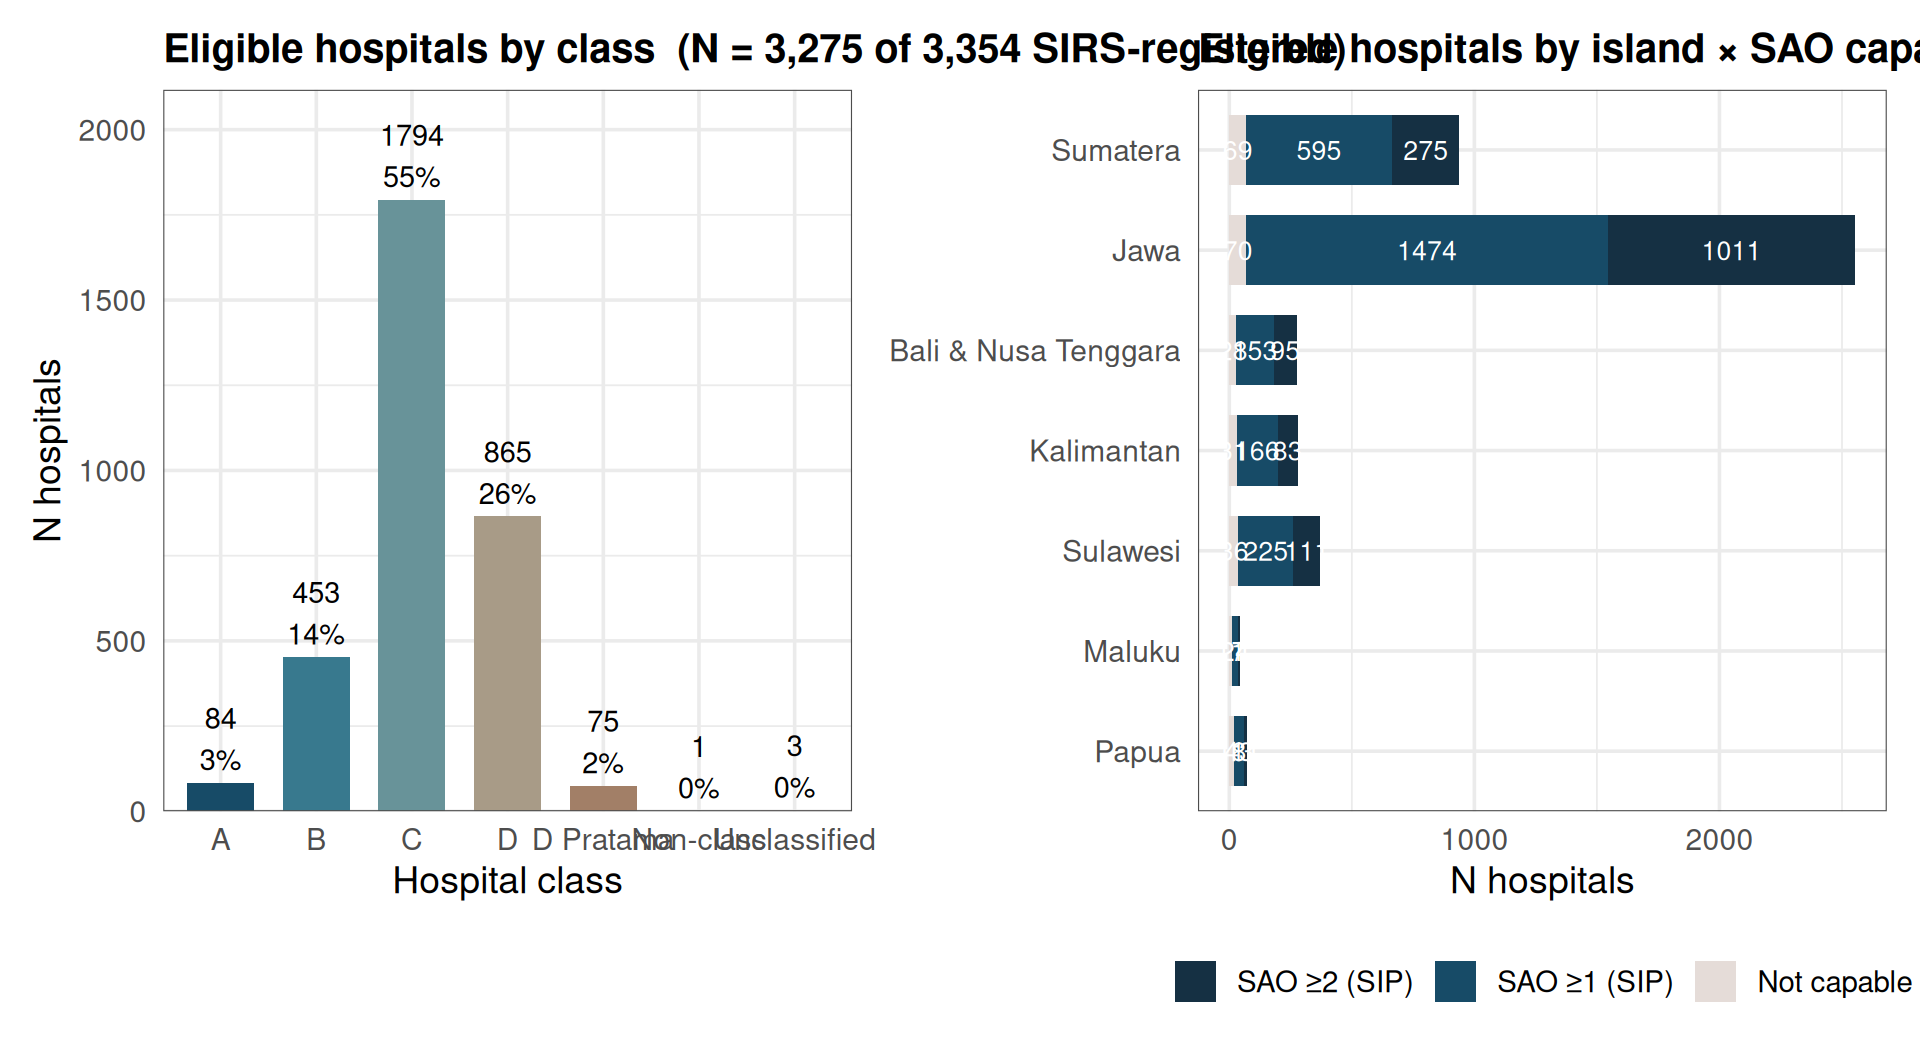
Study sample — hospitals
![]()
Study sample — BPJS claims
| 2016 |
103,259 |
8,740,371 |
8,844 |
6,842 |
745 |
1,261 |
| 2017 |
103,058 |
8,808,812 |
9,983 |
7,851 |
885 |
1,248 |
| 2018 |
111,693 |
9,587,176 |
11,268 |
8,976 |
944 |
1,352 |
| 2019 |
123,835 |
10,409,536 |
12,047 |
9,661 |
976 |
1,411 |
| 2020 |
97,945 |
7,678,694 |
12,402 |
10,480 |
839 |
1,089 |
| 2021 |
96,950 |
7,198,189 |
12,916 |
10,839 |
946 |
1,135 |
| 2022 |
137,099 |
10,715,926 |
14,690 |
11,719 |
1,449 |
1,523 |
| 2023 |
170,773 |
13,894,948 |
16,330 |
12,693 |
1,805 |
1,844 |
| 2024 |
194,201 |
16,185,911 |
17,039 |
12,696 |
2,155 |
2,193 |
| Total |
1,138,813 |
93,219,564 |
115,519 |
91,757 |
10,744 |
13,056 |
Claims = inpatient episodes after age/sex/date filters. Wt claims = sum of PSTV15 member weights. 2018 excluded (incomplete).
National SAO capability
(Fig 01)
![]()
Only 82% of eligible hospitals have at least one SAO team by practice permit (SAO ≥1 SIP). Full teams (SAO ≥2 SIP) cover 49%.
HC vs SIP gap — why two counts matter
(Fig 02)
![]()
SIP > HC reflects multi-site practice — the same specialist holds permits at multiple hospitals. Using SIP alone inflates apparent coverage; HC alone misses specialists active at secondary sites.
SAO capability by island (Fig 03)
![]()
Jawa concentrates SAO ≥2 hospitals. Papua, Maluku, and Kalimantan show the highest proportions of non-capable hospitals.
Bellwether procedure rates — national trend (Fig 04)
![]()
C-section dominates and grew from ~1,009 to ~1,333 per 100k WRA (2016–2024). Fracture fixation doubled. Laparotomy stagnant — possible ceiling or data artefact.
BW rates by hospital type (Fig 05)
![]()
Type C (mid-tier general) hospitals carry the largest share of national BW volume — consistent with JKN referral design where most insured patients access district-level hospitals.
Province-level BW rates (Fig 06)
![]()
SAO tier × hospital class (Fig 09)
![]()
Tiers are SIP-based (practice permit). Class C hospitals make up the largest volume; class A hospitals are the most likely to be SAO ≥2.
Hospital capability by class × criterion (Fig 10)
![]()
All five criteria shown simultaneously. Class A/B are consistently more capable; gap between HC and SIP rates is widest in class C/D.
Does workforce capability predict surgical output? (Fig 08)
District-level SAO capability (% hospitals meeting each criterion) vs pooled 2022–2024 crude BW rates.
![]()
Positive association across all five criteria, strongest for C-section. SAO ≥2 (SIP) shows the clearest signal.
Case fatality & cost (Fig 11, 12)
Laparotomy CFR fell from 4.5% → 2.4%; C-section CFR remains <0.2%. Cost per case rose in real terms across all procedures.
Patient drift — national trend (Fig 13)
![]()
~30–35% of bellwether procedures are delivered in a different district from the patient’s home district. Drift has been stable since 2019; it is not growing despite increased overall volume.
Net importer and exporter districts (Fig 14)
Jakarta, Surabaya, Makassar = dominant referral hubs (net importers). Surrounding peri-urban and rural districts are the largest exporters.
Population coverage by SAO-capable hospital (Fig 15)
![]()
Coverage by island group (Fig 16)
![]()
Jawa >90% coverage even under the strictest criterion. Papua <30% under SAO ≥1 (HC) and <15% under SAO ≥2 (SIP).
Coverage × surgical volume (Fig 17)
![]()
Weak positive association — many high-coverage districts still have low volume (demand-side or data-attribution issues).
Spatial coverage as a driver of patient drift (Fig 19, 20)
Districts with lower catchment coverage export more patients. Spearman ρ is negative (more coverage → less outflow), though effect is moderate.
Population burden per hospital (Fig 21)
![]()
Districts with higher population-per-qualifying-hospital ratios tend to have higher patient outflow — a supply-constraint signal distinct from geographic reach.
Key findings
- Full SAO teams are rare — only ~49% of eligible hospitals have ≥2 each of S, A, O by SIP.
- HC–SIP gap is largest for anaesthesia — multi-site anesthesiologists inflate apparent SIP coverage but don’t add team capacity at any single hospital.
- Workforce predicts output — districts with more SAO-capable hospitals consistently show higher BW procedure rates across all five criteria.
- Type C hospitals carry most volume — JKN referral structure funnels most BW cases to mid-tier general hospitals, not tertiary centres.
- Remote regions face a double gap — lowest SAO capability AND lowest spatial population coverage (Papua, Maluku, parts of Kalimantan).
- Patient drift is substantial and stable — ~1 in 3 BW procedures delivered outside the patient’s home district; low spatial coverage predicts higher outflow.
- Population burden matters independently — districts with high population-per-hospital ratios export patients even when geographic catchment looks adequate.
Limitations
- Hospital-level linkage not possible — SIRS/DREAMS and BPJS use different hospital ID systems; all linkage is at district level.
- DREAMS is a cross-sectional snapshot — workforce data reflects 2025; rate trends span 2016–2024. Workforce changes over this period are not captured.
- BPJS rates reflect delivery, not need — districts that export patients record lower rates than true surgical incidence suggests.
- ArcGIS service areas are static — 2-hour drive-time polygons do not account for road conditions, seasonality, or actual patient behaviour.
- 2018 excluded — incomplete year of BPJS visit tracking.
Thank you
Full report: Master_Report.html — figures labelled Fig 01–21 correspond directly to slide references.
Analysis pipeline: 8.1 Workforce (SIRS × DREAMS) → 8.2 Volume (BPJS claims) → 8.3 Timely Access (this report + ArcGIS integration)
ARC8 Global Surgery Institute · ARC Institute · 2026